

The backup airports absorbing America's private jet boom
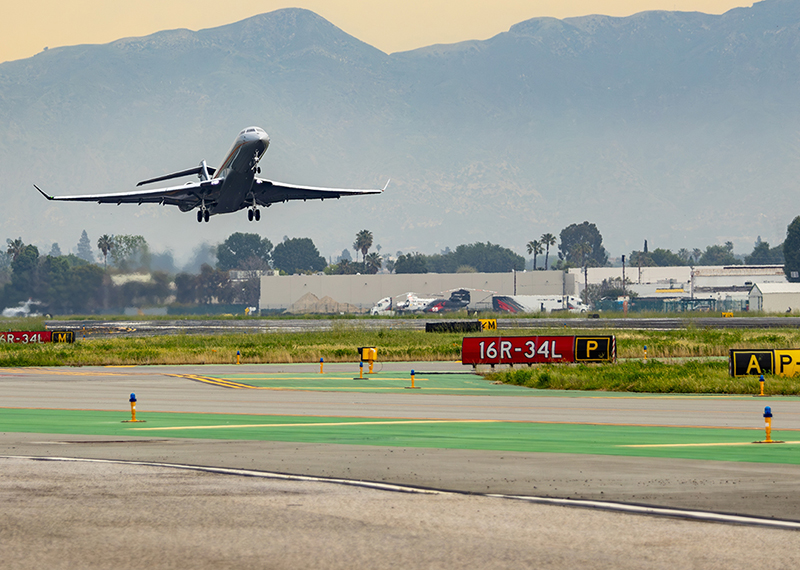
This year, more and more people flying private won’t touch down at JFK, LAX, or O’Hare. Instead, they will land at airports most travelers haven’t even heard of, places such as Teterboro, Westchester County, Van Nuys, and Opa Locka.
An underlayer of aviation infrastructure carries the bulk of the country’s business jet traffic, and an analysis of the 2025 numbers helps put the extent of the trend in perspective.
Flight restrictions, government shutdowns, and even wildfires all reshaped air traffic patterns around some of the country’s busiest general aviation fields. None of the traffic disappeared, but it did move directly into a tier of reliever and aviation airports that were built for exactly those types of situations. Paramount Business Jets has analyzed flight data from the National Business Aviation Association, the Federal Aviation Administration, the New York Times, GlobalAir, and more to uncover how the system works and the data that tracks it.
Why travelers are landing matters
The trends in where private jet travelers are moving may not seem important at first, but the story of business travel reveals deeper insights into the economy as a whole. Based on data from the National Business Aviation Association, general aviation, including business jets, supports more than one million U.S. jobs and generates roughly $340 billion in annual economic impact. These are not small figures.
Most of this activity happens outside the main commercial airports. When a restriction, staffing shortage, or disaster hits one location, the jobs, fuel sales, and tax revenues tied to that traffic don’t vanish. They simply move to whichever side the airport can absorb the overflow.
In WingX’s own words, last year was the “busiest year ever” for global business aviation, with flight sectors up 5% worldwide. North America handled 72% of all activity. That growth is happening against an already tight system.
Defining the tiers: What counts as a reliever airport
Let’s clear up what exactly a reliever airport is. The Federal Aviation Administration’s National Plan of Integrated Airport Systems, or NPIAS for short, is the master list of around 3,300 airports the agency considers to be part of the national system. This list includes every commercial service airport, reliever airport, and a select group of public-owned general aviation fields and airports, which together account for around 88% of the grand total.
Reliever status is a statutory category. It was created in 1968 for airports that were drawing slower general aviation traffic away from congested airports in major metropolitan areas. Historically, this meant 100 or more based aircraft or 25,000 or more annual itinerant operations. Nowadays, the FAA just classifies it as a nonprimary airport if it holds a reliever designation with 90 or more based aircraft.
Teterboro, New Jersey; Westchester County, New York; and Van Nuys, California, are classic examples. None handle scheduled airline service, but all sit inside or next to major metro areas and are equipped to catch traffic that would otherwise stack up at the primary hub.
The data
There are two main tools for tracking the change in airport traffic:
1. ATADS (Air Traffic Activity Data System): This is the FAA’s public tool for pulling historical operation counts and airport rankings. It serves as the raw material for seeing which fields around the country are gaining or losing traffic over time.
2. OPSNET (Operations Network): This is the companion system to ATADS that logs facility-level operations for air traffic control workloads and is used for staffing purposes as well. It is also the same data that underpinned the FAA’s decisions during the fall 2025 government shutdown.
Neither system specifically isolates business jet traffic, since both count all operations at towered airports. This is why the best analysts pair the FAA counts with private-industry trackers like ARGUS TRAQPak and WingX. These break down activity by aircraft segment, including light, midsize, heavy, and fractional. They can also isolate business jet departures in a way that the FAA data just can’t.
Case study 1: Palm Beach's Mar-a-Lago problem
During President Trump’s first term, flight restrictions around Mar-a-Lago applied only when he was actually there. That changed on Oct. 20, 2025. It was at this point that the FAA made the restriction permanent, implementing a 1-nautical-mile no-fly zone around the estate at all times.
The restrictions also include 10-mile and 30-mile rings that activate whenever he is there. Palm Beach International sits less than three miles from Mar-a-Lago, and the airport has had to reroute departures over different neighborhoods even on days when the president is nowhere near his Florida residence.
The repercussions were reflected at the airport level. At a county commission meeting in November, officials compared two example days in March to days before the restriction took effect. There were 630 total operations on a day without temporary flight restrictions compared to 338 operations just three days later when one was active. That’s nearly a 50% swing.
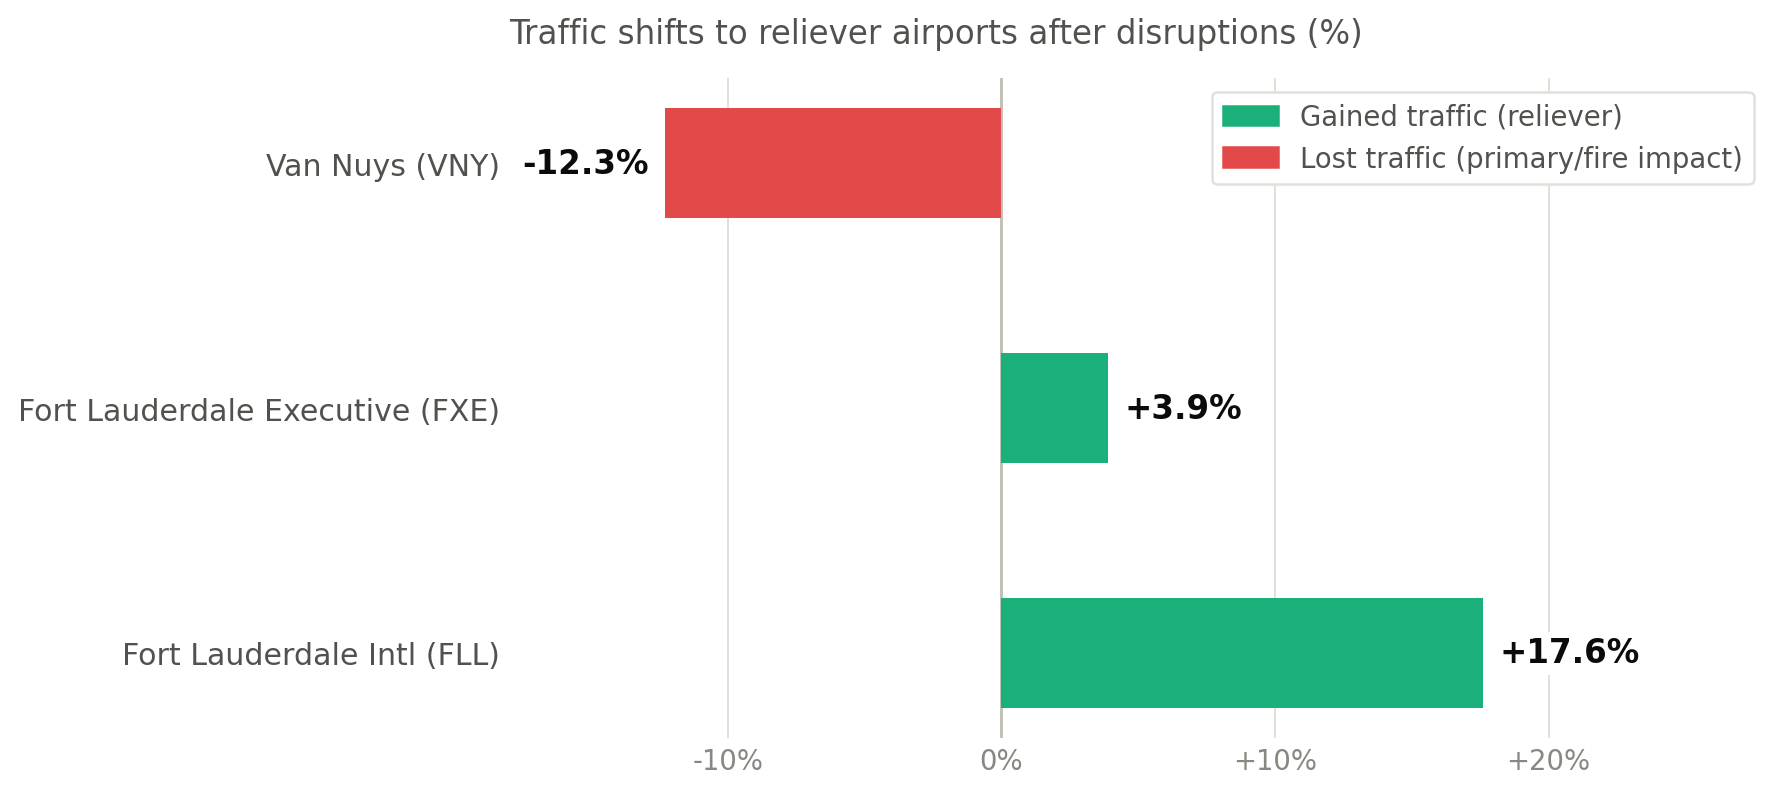
The traffic that left Palm Beach didn’t just disappear. Fort Lauderdale International jumped 17.6% and climbed four spots to 16th nationally for business aviation traffic, while Fort Lauderdale Executive gained 3.9%. Similarly, Boca Raton’s airport authority reported its own significant increase in activity during Trump’s visits. This was a direct result of sitting inside the restricted 30-mile outer ring. One restriction brought about a visible transfer of volume from primary airports.
Case study 2: The November 2025 shutdown bypass
The 2025 government shutdown lasted 43 days, leaving FAA controllers unpaid. By early November, the strain forced the agency’s hand.
On Nov. 6, the FAA ordered flight reductions ramping toward 10% at 40 of the busiest airports across the country. It escalated from 4% the first Friday to 6% by Nov. 11 and to the full 10% by Nov. 14, according to coverage from The Hill.
Three days after the initial Nov. 6 announcement, general aviation, including business jets, was outright barred from 12 of the 40 airports. Hartsfield-Jackson Atlanta, Chicago O’Hare, Dallas-Fort Worth, Los Angeles International, and JFK are just a few airports that were impacted.
The National Business Aviation Association said the move disproportionately affected an industry that supports over a million jobs. There were exceptions carved out for based aircraft, medical flights, firefighting, or military operations, but everyday charter and fractional traffic had nowhere to go except a reliever airport.
The episode was brief, ending on Nov. 12 when the House voted to reopen the government, but it was a real-time demonstration of what happens when 12 of the busiest airports in the country go dark. The FAA has no published airport-level figures showing where the redirected traffic went, but reliever spots were the only available option.
Case study 3: Van Nuys and the January 2025 L.A. fires
In January 2025, the Palisades and Eaton fires broke out. By the time they were eventually contained, more than 11,000 homes were destroyed, along with other structures throughout the greater Los Angeles area. Van Nuys, one of the busiest general aviation airports in the country and the preferred field for celebrities and executives, is within the broader wildfire region.
The airport’s full-year numbers reflect this. Departures fell by 12.3% in 2025, pushing the airport down to ninth place nationally for business aviation, per Paramount Business Jets’ own reporting. Commercial aviation felt a milder version of the same disruption, with roughly 15% of LAX departures and 12% of arrivals running late in the days immediately following the fires. Smoke, firefighting aircraft in the surrounding airspace, and general congestion all played a role.
Despite this, Van Nuys still remained in the top 10 in the country, demonstrating how deep demand runs in the market even amid a natural disaster.
The bigger pattern: Congestion as a constant tax
Three unrelated shocks to the airline industry — a permanent security restriction, a temporary staffing issue, and a natural disaster — led to the same underlying result.
Instead of traffic disappearing, it moves to the nearest field with a runway and ramp capacity. That is exactly what the reliever system is meant to do and has been doing since it was designated in 1968.
What makes the churn more visible now is sheer volume. U.S. private jet departures hit 2.63 million in 2025, a 5% year-over-year gain, soaring 29% above 2019 levels. A system running at record highs has far less slack to absorb a restriction easily, so when one airport gets squeezed, it’s easy to see the overflow in a neighboring field.
The pattern tends to repeat across the country. Palm Beach and Fort Lauderdale. Teterboro and Westchester. Los Angeles International and Van Nuys. Dallas-Fort Worth and Love Field. Each pair functions less like two separate airports and more like one cohesive system with two runway options, where restricting one field simply reroutes traffic to the other.
What to watch next
These changes in traffic will test how durable the reliever system actually is. The Mar-a-Lago restriction is set to run through October 2026 at a minimum, so Fort Lauderdale and Boca Raton will likely keep absorbing traffic through the rest of this year. Precautions have been put in place to avoid another staffing issue in the event of a shutdown. Natural disasters, on the other hand, are unpredictable. And no one can predict what other impacts may shake up airline traffic in the coming years.