But those flights aren't spread across thousands of airports equally. A relatively small number of fields handle the bulk of the traffic. Paramount Business Jets went through the ARGUS TRAQPak 2025 Business Aviation Review (via Private Jet Card Comparisons) and WingX's annual flight activity data (via Private Jet Card Comparisons) to figure out which airports are absorbing the most volume and why.
Why these airports and not others
Two things determine where private jet traffic ends up: money and geography. If an airport is close to a major financial center or a zip code full of high-net-worth individuals, it's going to be busy. That's just how this works.
The other piece is infrastructure. An airport can be in the right location but still lose traffic if it doesn't have the FBO capacity, ramp space, and 24/7 operations that charter and fractional clients expect. The airports on this list have all of that.
The 10 busiest U.S. private jet airports in 2025
Full-year departure data from ARGUS TRAQPak shows a familiar hierarchy at the top and some reshuffling further down. Here are the 10 busiest airports for private aviation in 2025:
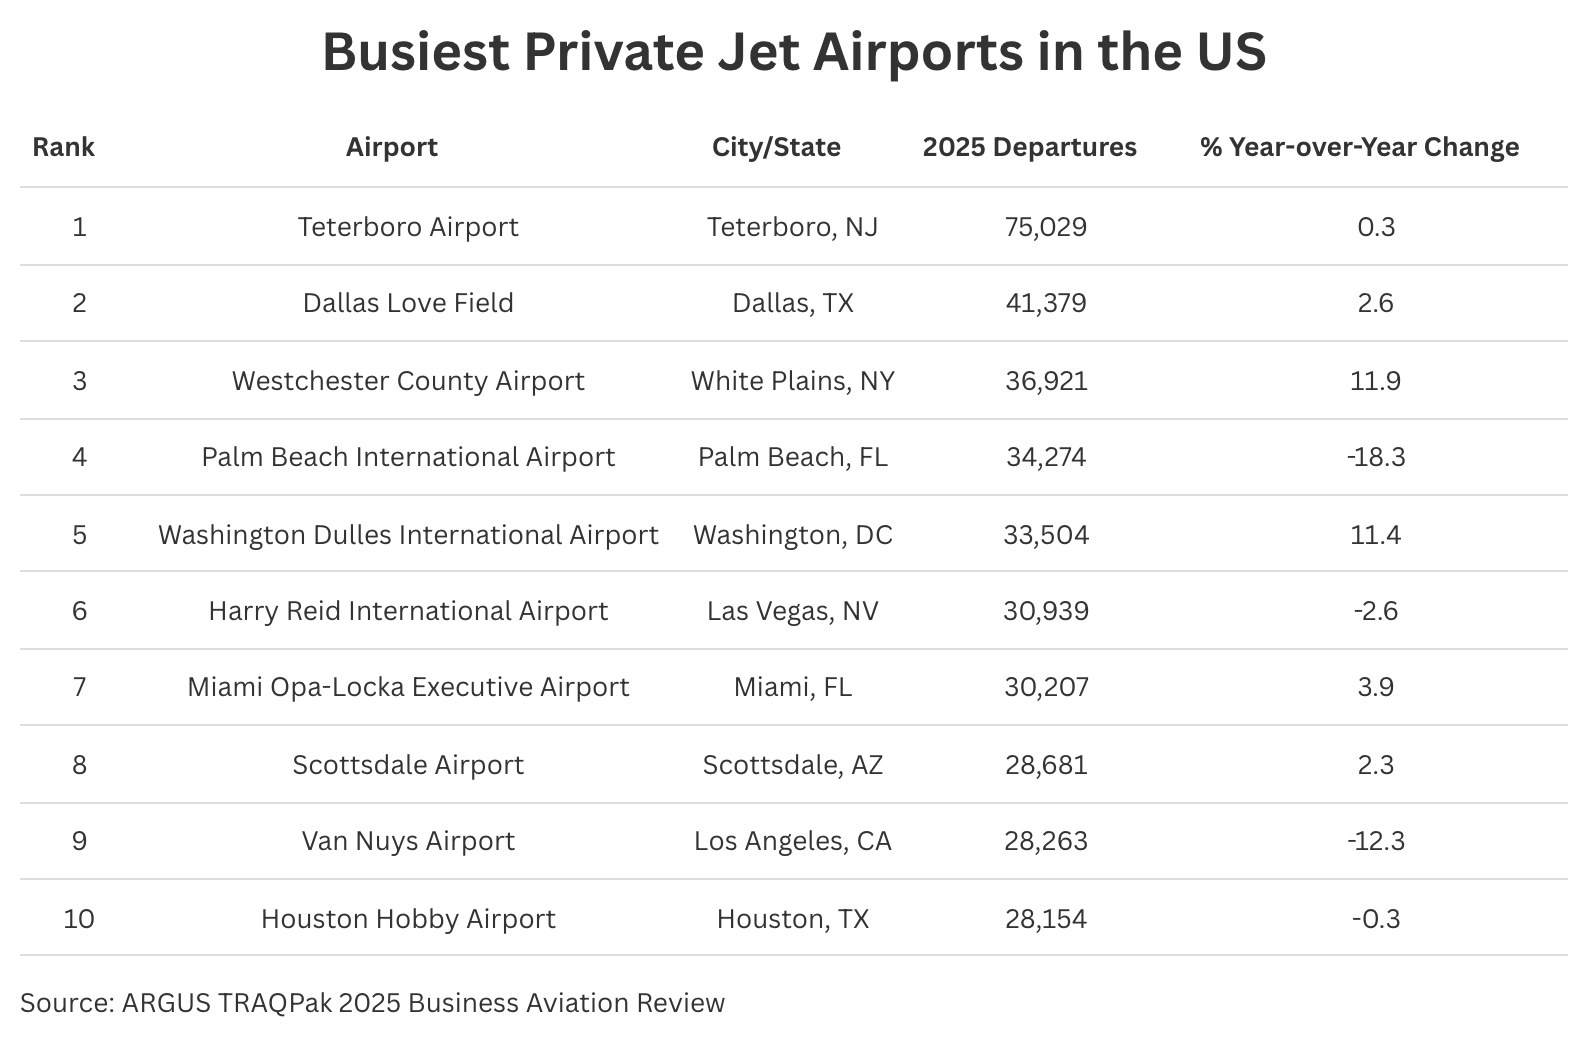
No surprise at No. 1. Teterboro logged 75,029 departures in 2025, essentially flat year over year, but the gap between it and everyone else is enormous. No commercial service, a 100,000-pound weight limit that keeps airliners out, and a location 12 miles from Midtown Manhattan. The ramps are full of Gulfstreams for a reason.
Dallas Love Field climbed from third to second with 41,379 departures (up 2.6%). Four FBOs operate there: Jet Aviation, Business Jet Center, Signature, and Atlantic. The gain probably tracks with Dallas's growth as a corporate relocation hub.
Westchester County Airport is the one to watch. An 11.9% surge pushed it to third place with 36,921 departures. The White Plains field serves the affluent suburbs north of New York City, and demand there is growing faster than almost anywhere else in the Northeast.
Dulles is the story. Back in the top five for the first time since 2018, it posted 33,504 departures after an 11.4% jump. Most of that traffic is government contractors, lobbyists, and diplomatic missions. For years, Dulles slipped down the list while the government worked remotely during and after the pandemic. That era appears to be over.
Palm Beach International fell from second to fourth, down 18.3%. Temporary flight restrictions around Mar-a-Lago when President Trump is in residence pushed traffic to nearby airports. Fort Lauderdale International posted a 17.6% gain, which tells you exactly where those flights went. Van Nuys also took a hit, dropping to ninth after a 12.3% decline tied at least partly to the January 2025 fires that destroyed over 11,000 homes.
How the industry got here
Airport rankings tell you where the traffic goes. Year-over-year departure numbers tell you whether the industry is growing or contracting. According to WingX data, U.S. private jet departures have been climbing since the pandemic bottom, and 2025 set a new high:
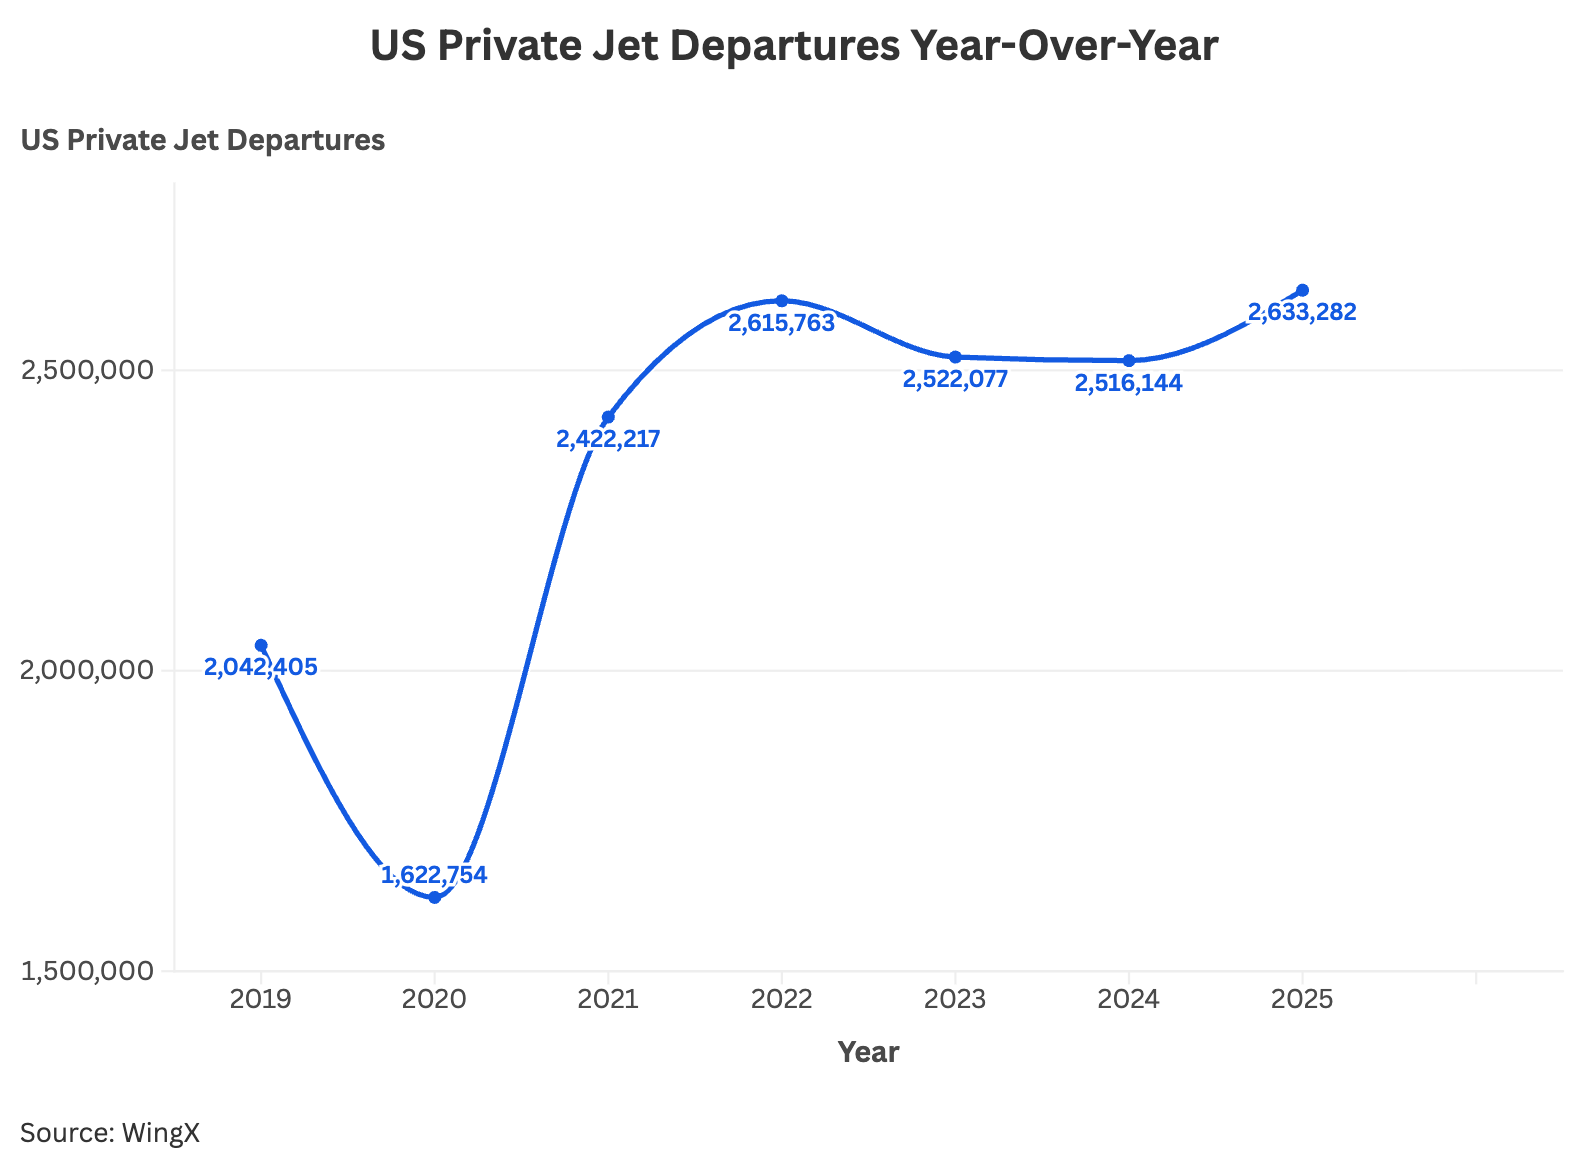
That 2025 total of 2,633,282 departures is a 5% year-over-year gain, and 29% above 2019 levels. After peaking in 2022, the U.S. numbers dipped in 2023 and again in 2024. A lot of people in the industry were starting to wonder if the post-pandemic boom was finished. Apparently not.
The fleet mix is shifting, too. Super midsize jets posted the largest year-over-year increase at about 7%, with over 660,000 U.S. departures. Ultra-long-range jets are up nearly 70% compared to 2019. However, fractional ownership is where the real growth story is concentrated. Part 91K departures climbed roughly 10% in 2025 alone, demonstrating how this traditionally smaller segment is changing rapidly.
What the map looks like
Looking at the top five airports by departure makes one corridor clear: the Northeast. Teterboro, Westchester, and Dulles all featured a combined 145,000 departures. Flights between New York and Washington run constantly, carrying people who work across both cities. Dallas, in the second spot, rounds out the picture for this corridor. If you wanted to have a shot at predicting this list, Wall Street, K Street, and the Fortune 500 relocations to Texas would be a good place to start.
Continuing further, the Sun Belt has also put up some impressive numbers. Major cities, including Scottsdale, Las Vegas, and Houston, all either held positions or moved up in the rankings. Also worth mentioning is Van Nuys, which managed to keep its spot despite the recent LA fires, which goes to show just how much demand this market generates.
Congestion is the tax you pay
Increased departures aren't all sunshine and roses. This much traffic going through so few airports is a recipe for congestion, but it does follow a predictable calendar. Teterboro’s ramp gets packed during Fashion Week and big finance conferences, for instance. Similarly, South Florida surges every winter as snowbirds arrive, and the Mar-a-Lago TFRs compound the problem at Palm Beach. Every airport has unique congestion patterns, so it’s important to know the patterns of where you’re flying.
If you do have to fly through these airports regularly during peak windows, you already know this. For everyone else, there’s a sneaky trick to consider: spillover airports. Morristown Municipal, Essex County, and Monmouth Executive are all examples that serve the New York area with less pressure on the ramp. Fort Lauderdale's two airports have been picking up Palm Beach overflow for some time now, which the 2025 data confirms too.
Stepping back
Teterboro being at number one tells a clear story about New York money. Dallas, in the second spot, spills information on the corporate migration to Texas. The surge from Westchester details a tale about suburban wealth. Dulles making waves shows government workers are traveling again, and the Sun Belt airports rise as those seeking warmer weather. None of these trends is particularly surprising, but seeing it all laid out in the number of departures leaves no room for error.
The above rankings haven’t changed much across market cycles either, so if you’re planning to travel through any of these hubs, congestion patterns from this year will probably look similar next. Use this information to plan your next getaway or business travel to avoid the lines.